Thematic maps of population and economy series include thematic maps of international tourism in 2014, comparative maps of average income of urban and rural residents, thematic maps of Thematic map of Port Cargo Transshipment Volume and education, covering income, education, tourism and transportation of residents. It also provides a layout containing complete elements such as map name, legend, scale and so on, which can directly print out maps and provide reference for users to make maps for publishing, printing or screen printing.
Data description
Vector Data comes from the public version of China's 1:1 million scale data produced by the National Bureau of Surveying, Mapping and Geographic Information, and the attribute data is downloaded from the national data website of the National Bureau of Statistics (http://data.stats.gov.cn/index.htm).
| Dataset Name | Dataset Type | Data classification | A detailed description |
| Capital_P | Point Dataset | Administrative point | Capital |
| ProvinceCapital_P | Provincial capitals outside the capital | ||
| Border_L | Line Dataset | Administrative boundaries | National boundaries |
| Province_L | Provincial boundaries | ||
| Coastline_L | Coastline | ||
| Province_R | Line Dataset | Administrative side | Provincial attributes include thematic data such as resident income, education, tourism and transportation. |
| MainRiver_R | Water system | Major rivers, including the Yangtze and Yellow Rivers | |
| Island_R | Islands | Islands | |
| Border20000 | Other face elements | Buffer Radius: 20000 meter | |
| Border40000 | Buffer Radius: 40000 meter | ||
| Border80000 | Buffer Radius: 80000 meter | ||
| ProvinceName_Tourism | Text/CAD Dataset | Auxiliary elements | Province name in tourism thematic map |
| ProvinceName_Income | Comparison Chart of Average Income of Urban and Rural Residents Province Name | ||
| ProvinceName_Cargo | Thematic map of Port Cargo Transshipment Volume province name | ||
| ProvinceName_Education | Educational Thematic Map Provincial Name | ||
| IslandName1 | Island name in main image | ||
| IslandName2 | Names of islands in the drawings | ||
| SeaName1 | Name of sea area in the main map | ||
| SeaName2 | Name of sea area in the attached drawings | ||
| Tourism | Thematic Elements in Tourism Thematic Map | ||
| Region_Tourism | Regional Annotation in Tourism Thematic Map | ||
| Income | Thematic elements in the comparative chart of average income of urban and rural residents | ||
| Cargo | Thematic elements in Thematic map of Port Cargo Transshipment Volume. | ||
| Education | Thematic Elements in Educational Thematic Maps |
- Source of data
- Data content
Data Processing
After registering and logging in the national data website, you can download data in excel/CSV/XML/PDF format. Here, excel format is taken as an example, and other formats are imported in a similar way. Download the provincial "international tourism (foreign exchange) income" data, directly download the data suffix.xls, save it as.xlsx in Excel software, and Delete the descriptive text at the beginning and end of the Table. Create a new file type database, Import Data, check the "1st" Row as Header ", and store the imported excel table in the database in the form of an attribute table.
(1) Organize the imported attribute table
Before drawing, you need to add the imported data to the Vector Data attribute table for Create Thematic Map by using the Data Processing "→ Append Column function in the Data tab. Since the Type of the two data Connection Fields is required to be exactly the same when appending the column, the imported data table should be sorted out before appending the column.
Add the name of each province as the Connection Field. Because the Name in Province _ R is a wide character with a length of 60, first set the "International Tourism (Foreign Exchange) Income" data Add FieldName, Type as a wide character with a length of 60. And use the Edit → Update Column function in the Property Sheet tab to update the province name.
(2) Attribute data appending
Append the imported data to Province _ R with Name as the Connection Field.
The data needed to produce the Population and Economy series of thematic maps can be added to the attribute table of Province _ R in this way.
- Data Import
- Data Processing
2014 International Tourism Thematic Map
The thematic map of international tourism in 2014 reflects the number of international tourists and foreign exchange earnings of each province in 2014.
(1) Map design
Scale: 1:22 000 000 for the main map of China and 1:44 000 000 for the attached map of the South China Sea Islands
Map projection: Geographic Coordinate System is China2000, Mercator projection
(2) Preparation of base map
For Province _ R, Unique-values Map is made according to the eastern region, western region, central region and northeast region to distinguish different regions, and add elements such as national boundaries, coastlines, provincial boundaries, main rivers, islands and annotations, administrative points and annotations, and provincial names. National boundaries need to be made according to the national standard code GB Unique-values Map to distinguish the established boundaries from the unestablished boundaries. The color of the coastline is slightly lighter than national boundaries. The main rivers, including the Yangtze River and the Yellow River, are represented by the method of thin blue lines and light blue filling. The islands need to clearly show the graphics and annotations of Diaoyu Island, Chiwei Island and other islands. The administrative point indicates the point symbol and annotation of the capital and provincial capital, and the color of the provincial name is slightly lighter than that of the capital and provincial capital.
(3) Making thematic symbols
Symbols that can be used in thematic maps include simple symbols and pictographic symbols. Pictographic symbols are widely used because they can remind readers of the characteristics of mapping objects, and their shapes and colors are flexible, and their mapping effects are rich and interesting. Users can directly use the Raster Symbol provided in the software, or make their own symbols, and then import them into the Symbol Library through the symbol import function.
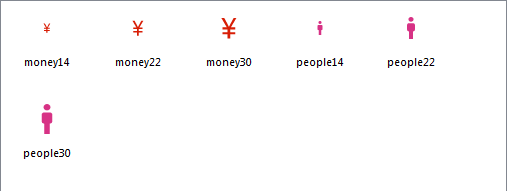 |
| Figure: Symbol making |
(4) Create Thematic Map layer
This chart uses the stacking of symbols to quantitatively represent the two major elements of the number of international tourists and foreign exchange earnings of each province. The thematic layer is made by CAD Dataset. In CAD Dataset, symbols of different sizes are assigned to represent different values, and the number of tourists and tourism revenue of each province are arranged in the province by means of symbol stacking.
(5) Making the attached map of the South China Sea Islands
For the horizontal thematic map of China, the South China Sea Islands are generally placed in the lower right corner of the map as an attached map, and the scale is half of the scale of the main map. Although the scale of the South China Sea Islands map is relatively small, when it is placed next to the main map, the annotations on the map need to be continuous with the main map, so the South China Sea Islands map needs to be made separately, and the South China Sea part of the main map can not be directly reduced.
The attached map of the South China Sea Islands shall be made in the same way as the base map of the main map, but two points shall be noted: one is that the text on the attached map shall be continuous with the main map, the expression elements shall be the same as the main map, and the text shall be properly shifted where it is crowded; the other is that the radius of the boundary buffer zone used to make the color of the national boundary shall be doubled.
(6) Add necessary contents such as drawing name, legend and explanatory text.
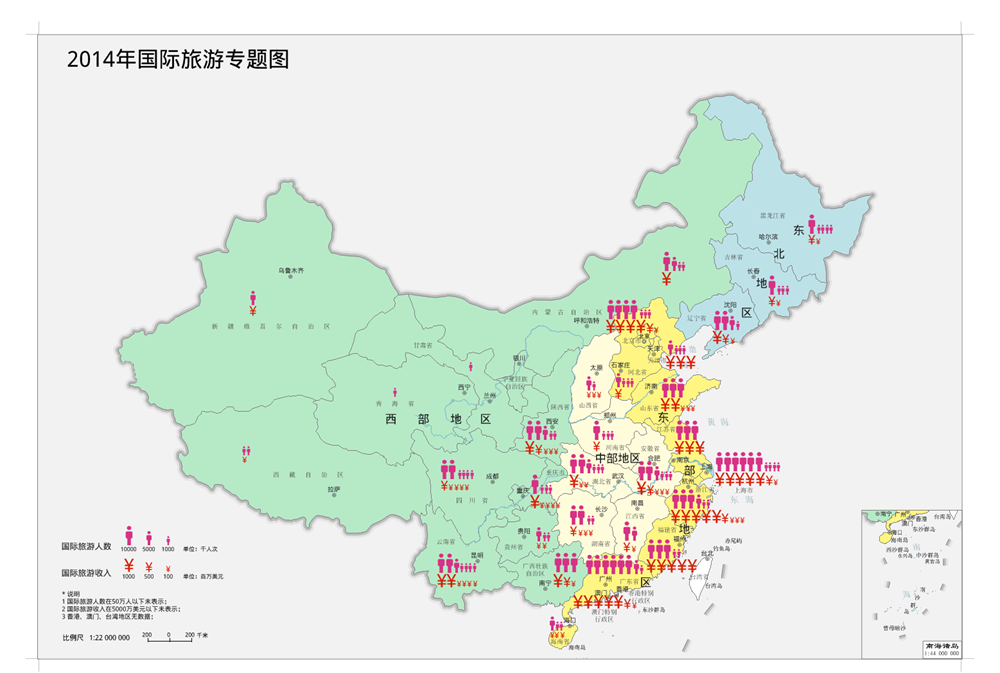 |
| Figure: 2014 International Tourism Thematic Map |
- Map description
- Production process
Comparison chart of average income of urban and rural residents in 2014
The average income comparison chart of urban and rural residents in 2014 reflects the comparison between the income level of urban and rural residents in each province and the average income level in 2014, as well as the comparison between these three indicators and the consumption level of the province.
The map design, base map production, South China Sea Islands attached map production and decoration of this map are consistent with the international tourism thematic map in the third part above, and this part only explains the different parts.
(1) Preparation of base map
For provincial Province _ R, the Graudated Colors Map is made with the per capita consumption level of each province as the expression, starting from the 15000 yuan, every 5000 yuan is divided into a section, which is divided into five sections.
(2) Create Thematic Map layer
This chart expresses the urban per capita income, rural per capita income and local income level of each province in the form of a histogram. Different from the traditional histogram, the histogram is a circular histogram, and uses a slight color gradient to create a three-dimensional effect. The specific production method is as follows: after making an ordinary histogram, right click to save it as CAD Dataset. And then further editing and processing are carried out in the CAD Dataset.
 |
| Figure: Histogram Adding Gradient Contrast |
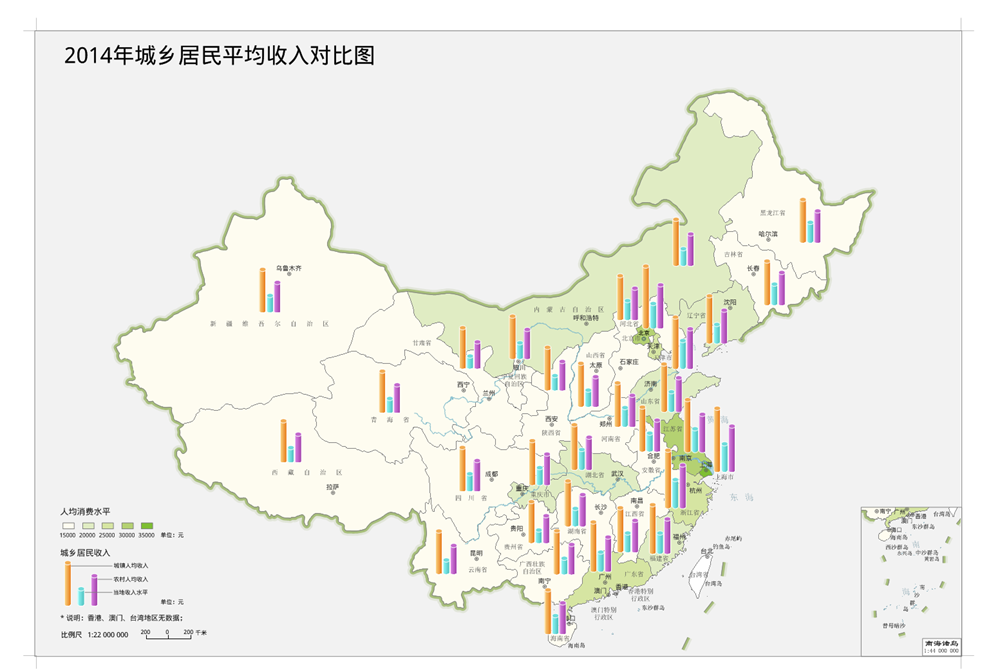 |
| Figure: Comparison of average income of urban and rural residents in 2014 |
- Map description
- Production process
Thematic map of Port Cargo Transshipment Volume for 2014.
The 2014 Thematic map of Port Cargo Transshipment Volume reflects the total transit volume of port cargo in each province in 2014.
The base map uses the GDP of 2014 as the expression to make the Graudated Colors Map, and the thematic elements use the symbolic stacking method to express the port cargo transit volume of each province. The stacking symbol method is a quantitative representation method of thematic elements. Readers can directly read the specific values of thematic elements in each province on the map through the different values represented by the squares of different sizes in the legend.
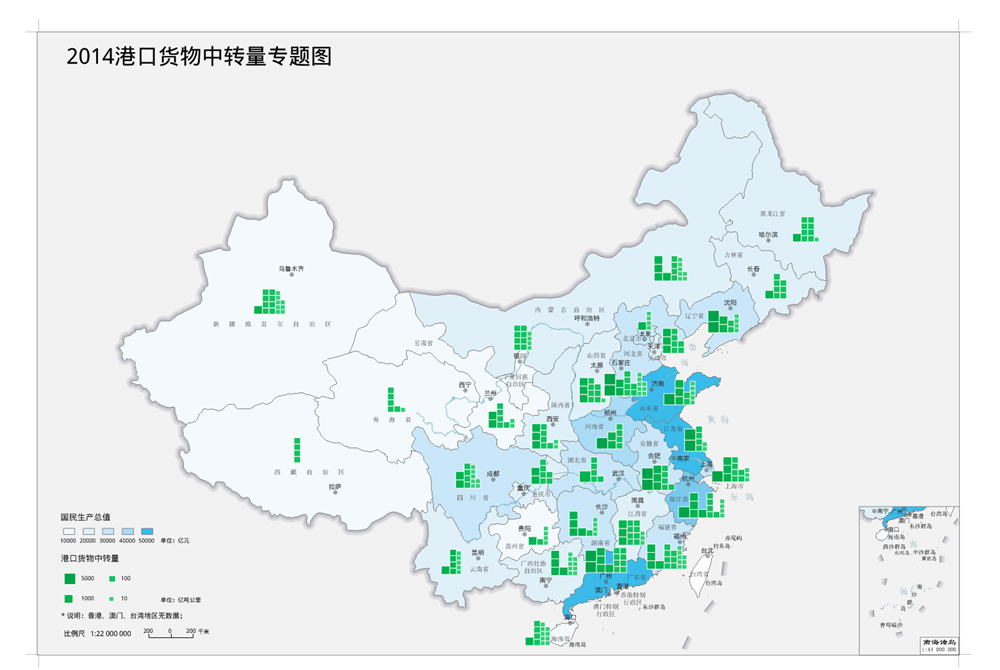 |
| Figure: Thematic map of Port Cargo Transshipment Volume in 2014 |
- Data description
- Production process
Education Thematic Map 2014
The thematic map of education in 2014 reflects the composition of the educational level of the population in each province and the composition of educational funds.
This chart uses two Stacked Bars to represent the two themes respectively. The left part of the stacked chart represents the composition of education expenditure, which mainly represents the proportion of national education expenditure in the total education expenditure. The right part of the stacked chart represents the composition of the number of primary, secondary, high school and university students in each province.
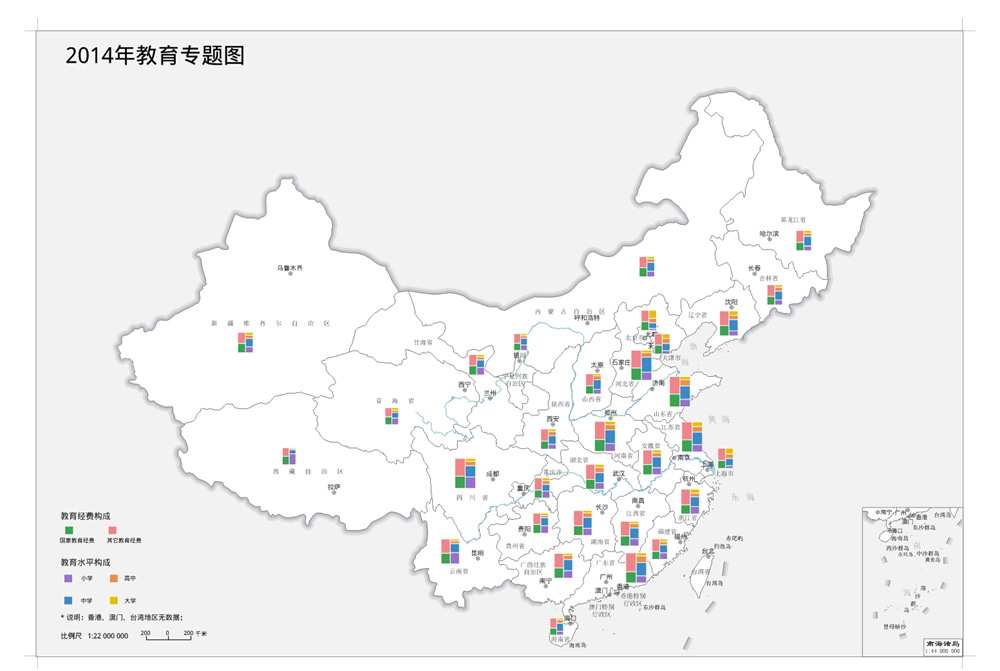 |
| Figure: 2014 Education Thematic Map |
- Data description
- Production process


