A series of features are provided for mosaic dataset management. Below content details each feature.
 Browse Attributes
- SmFileName: The file names (extension excluded) of all original image files managed in the mosaic dataset, as well as the file names of overviews(extension included).
- SmPath: The full path (absolute path) of all original image files that are added to the mosaic dataset and the full path of every overview file. The paths support the network sharing paths. Therefore, you can realize the shared use of the mosaic dataset by editing this field .
- SmCategory: To identify whether the currently displayed image is the original data or overviews. 1 means displaying the original data. 2 denotes displaying the overviews.
- SmMinPS and SmMaxPS: they are obtained from LowPS/ HighPS and used for the creation of dynamic mosaic images when displaying images. Generally, without an overview, SmMinPS is 0 and SmMaxPS is HighPS * 10. For example, SmLowPS = 8m and SmHighPS = 16m of Gaofen-1 multi-spectral band, then SmMinPS=0 and SmMaxPS=160. The unit of SmMinPS/SmMaxPS is the same as the map unit. If the map uses a latitude-longitude coordinate system, the numerical unit is degree. If the map uses a projected coordinate system, the numerical unit is meter.
- SmLowPS and SmHighPS: they are obtained from raster data to define the max and min resolutions. The unit of SmLowPS/SmHighPS is the same as the map unit. If the map uses a latitude-longitude coordinate system, the numerical unit is degree. If the map uses a projected coordinate system, the numerical unit is meter. For example: the resolution of Gaofen-1 multispectral band is 8 meters, and the resolution of panchromatic band is 2 meters. Before creating image pyramids, the SmLowPS/SmHighPS values in the attribute table are equal. After creating image pyramids, the LowPS value is the base resolution, and the HighPS is the resolution of pixel of the top image pyramid. For the GF-1 multispectral band, the base resolution is 8 meters, and the top pyramid pixel resolution is 16 meters; for the panchromatic band, the base resolution is 2 meters, and the top pyramid pixel resolution is 16 meters.
- SmZOrder: default value is 1. You can modify values of the field to control the dispaly order of images. Images display as the reverse order of SmID normally. You can set Object Display Order to SmZOrder in the Layer Properties panel.
Right-click your mosaic dataset and select "Browse Footprint Attributes" to open the attribute table which is the attribute table of the footprint data actually. Of which, every record matches an footprint object. Primary fields of the attribute table:
 |
| Figure: attribute table |
 |
| Figure: Attribute Table |
 Add Image
After creating the dataset, you can continue to add .tif, .tiff, .img files to this dataset. The specific operations are as follows:
Functional Entrances
Right-click your mosaic dataset and select Change Mosaic Dataset > Add Raster.... In the popup dialog box Add Mosaic Data you can add new images. You can add a single file, or files through importing a folder, or a folder list.
 Create Image Pyramid
To improve the display effects of a lot of image data, you can create a pyramid for your data. The program will create multiple levels of pyramids as a rule to make the pyramid image with relative resolution display in different scales. When creating overviews, pyramids are needed for all images in your mosaic dataset.
Functional Entrances
Right-click your mosaic dataset and select Optimize Mosaic Dataset > Build Image Pyramid.
Parameter Description: sets parameters for the creation of image pyramids.
- The application provides the following methods for data resampling.
- Nearest: Take the most adjacent pixel values of input raster dataset as input values to assign the relative pixels of output raster dataset.
- Average: Resample by calculating the average of all valid values.
- Gauss Kernel Calculation: Re-sample data in the way of Gauss Kernel Calculation. For the kinds of images with high contrast and image boundaries, the resampling way are better.
- Average Complex Data Averages complex data in magphase space.
- Bilinearity: Assigns the weighted average of values of 4 nearest neighbor cells in the input to the corresponding cells in the output. The resulting data is smoother than the nearest neighbor method, but the original raster values will be changed.
- Cubic Convolution: Similar to bilinearity, it can assign the weighted average of values of 16 nearest neighbor cells in the input to the corresponding cells in the output. The resulting data is the clearest, and the boundary of the raster data is sharpened. But the calculation amount is large and the processing time is long.
- Cubic Linearity: this method is achieved based on the Akima interpolation method. When performing the interpolation between two points, in addition to the two measured values, the Akima interpolation method needs to use the observed values of the four measured points that are adjacent to these two points. And so this method requires 6 pixel values to resample the input raster data. Since the algorithm takes into account the effect of element derivative values, the resulting curves are smooth and natural.
- Lanczos Sine Resampling: The lanczos method utilizes a convolution filter to move the origin of the convolution function to the center of each resampling, then multiply all the values in the input with the value of the convolution function at that location, and add them together. The convolution function, also known as the Lanczos kernel, is based on the function sinc(x)=sin(x*pi)/x.
- Compression Type: the application provides three compression types including DEFLATE, JPEG, and LZW.
- Task Number: Set the number of processes to create image pyramids.
 Build Overviews
To make the display effect of mosaic dataset better, only footprint will be shown in smaller scales by default.
Functional Entrance
Right click your mosaic dataset and select Optimize Mosaic Dataset > Build Overview....
Parameter Description: set the maximum width, maximum height, sample tolerance, and output path.
- Max Width and Height: Set the maximum width and height of overviews.
- Sample Tolerance: The resolution ratio between two adjacent levels of overviews.
- Output Path: The storage paths of overview files.
- Remove: Some black boundaries may appear because of the overlaps between the novalue areas and the normal area. Hence, you can specify a value for non-value areas to display data normally.
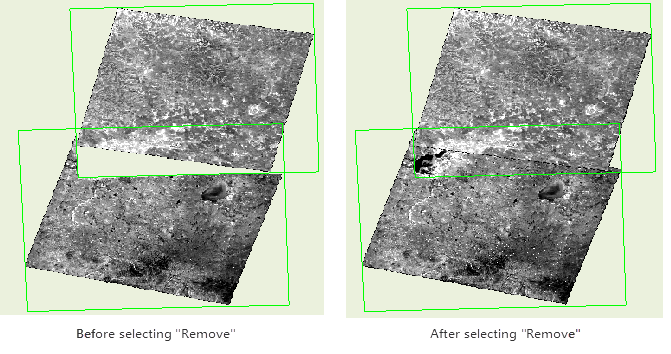 |
| Figure: The comparison image |
Building overviews for mosaic datasets is actually a reconstruction of the multi-layer pyramids according to some rules for the original image. After the overview is built, the mosaic dataset can be shown at a small scale and image files are generated and saved under the overview output path. Related records will be added into the footprint attribute table.
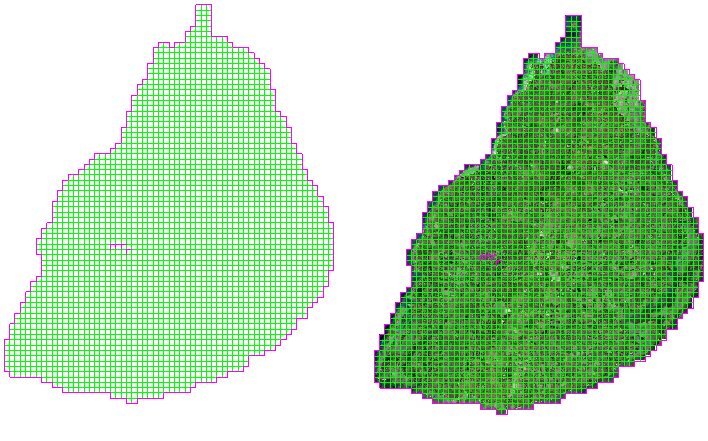 |
| Figure: The comparison before and after generating overviews. |
Note: The visibility of an overview of mosaic data is controlled by SmMinPS/SmMaxPS. When the resolution of the overview is bigger than the value of SmMaxPS, the corresponding mosaic dataset is invisible.
If your mosaic dataset composes of a big amount of images and has large bounds, you can modify the values of these two fields SmMinPS and SmMaxPS to make your mosaic data visible in a small scale.
 Check and Optimize Mosaic Datasets
Quickly checks and optimizes data managed in the mosaic dataset, like creating image pyramids, setting compression ways, etc.
Functional Entrance
Right click on your mosaic dataset and select Optimize Mosaic Dataset > Check and Optimize Data... The popup dialog lists all data managed in the mosaic dataset.
Parameter Description
- Block Storage and Compress: check the box to use block storage and a compression type. Using block storage can speed up the loading and browse of image data, thereby optimizing the efficiency of data processing.
Images can be saved in three ways: scanning line storage, stripe storage, and block storage. The following content describes how the application reads images saved in different ways.
- Scanning line: The system reads on row at a time.
- Stripe storage: The system reads N rows according to the specified stripe width N.
- Block storage: The system reads N blocks according to the specified block number N.
- Scanning line: The system will read 2560 times, and each time the size of the data read is 1*2560.
- Stripe storage: The system will read 2560/N times, and each time the size of the data read is 2560*N. The greater N is, the more memory will be used. The memory used will affect the read speed.
- Block storage: The image will be divided into 100 blocks at the size of 256*256. The system needs to read 100 times at most, and each time the size of data read is 256*256, which decrease the display time and enhance the read efficiency. Compared with the above two modes, block storage is a better way for storage.
- Compress Type: the application provides three encoding ways including: DEFLATE, JPEG, and LZW for users to select.
- Image Pyramid: check the box to create image pyramids.
- Resample Method: select a way to create image pyramids. The supportive methods include: Nearest, Average, Gauss Kernel Calculation, Average Complex Data, Bilinearity, Cubic Convolution, Cubic Linearity, Lanczos Sine Resampling, and Pattern Resampling.
- Use GDAL: check the box to use GDAL to optimize data.
- Task Number: specify the number of processes to enable multiple tasks to optimize data. The default value is the number of available processes time 2.
Here we take reading image at 2560*2560 as an example.
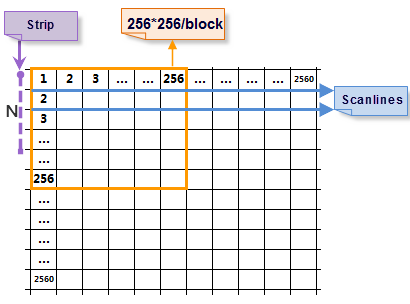
Figure: 2560*2560 image  Reassign Raster Path
Respecify the path of each image or the path of an overview.
Functional Entrances
Right-click your mosaic dataset, and select Change Mosaic Dataset > Reassign Path... to open the Reassign Image Data dialog box where you can modify the paths of original files and overviews' paths.
Parameter Descritpion
- Original Directory: If the path of original images changes, you can reset it to call images normally.
- Path of overview: Update the storage path of overviews.
 Clear Data
Functional Entrances
Right-click your mosaic dataset and select Clear Data... to open the Clear Data... dialog box.
You can select to remove all records or only remove overviews from the mosaic dataset.
 Rebuild Bounds
If some changes happen in your mosaic dataset, you can rebuild the range of your mosaic dataset by clicking the function. For more details, please refer to Image map configuration - rebuild data range.
Function Entrances
Right click your mosaic dataset and select Change Mosaic Dataset > Rebuild Bounds.
- Rebuild Footprint: You are allowed to rebuild footprint.
- Rebuild Boundary: Rebuild the boundaries of your mosaic dataset. Two ways are provided including:
- Select Dataset Bounds: Choose a region dataset to rebuild bounds.
- Custom Bounds: Set up bounds through drawing bounds or selecting objects.
- Rebuild Clip Bound: You are allowed to rebuild clipping bounds.
- Use Footprint Bound: build the clip area based on the footprint of image data and update it to the clip dataset.
Clip Offset: if there are some NoValue areas falling into the borders of the clip area, you can specify a clip offset to make the clip area smaller than the footprint.
- Auto Calculation of Clip Bounds
The valid areas of image data can be regularly shaped like the parallelogram shown below and irregularly shaped.
Figure: the vaid area of image data is a convex polygon Figure: the vaid area of image data is irregularly shaped Before performing the automatical calculation of clip bounds, some settings of parameters are a must.
For irregular shaped area, you are required to check Complex Polygon. But for irregular shaped area, it doesn't matter to check Complex Polygon or not.
The parameter Exact Clip will calculate the clip area based on the original image data, which is much accurate. If you don't select the item, the accuracy of the resulting data is not very high. However, the calculation is performed based on image pyramids, and so it is very fast.
When extracting the valid borders of image data, the areas with NoValue cells will be taken as valid areas. If you set the tolerance to any value, not 0, the cells close to the NoValue cells in the tolerance range will be taken as NoValue cells. Therefore, setting a proper tolerance can remove some invalid cells.
Besides, checking the Complex Polygon box can still get the correct results for convex polygon shaped areas.
Original image files
The automatic calculation results
Supported or not

3 bands 8 bit unsigned IMG image
NoValue: 0

Calculate based on source images
v
Calculate based on image pyramids
v

3 bands 8 bit unsigned IMG image
NoValue: 0

Calculate based on source images
v
Calculate based on image pyramids
v

Single band 8 bit unsigned IMG image
NoValue: 0

Calculate based on source images
v
Calculate based on image pyramids
v

3 bands 8 bit unsigned IMG image
NoValue: 0

Calculate based on source images
v
Calculate based on image pyramids
v

7 bands 8 bit unsigned TIFF image
coordinate system: EPSG:4326
Image size: 238M
NoValue: 255
Special cells of valid areas of image data:
[1] Similar to an enclave, the area connects with the main area by one cell.


[2] An enclave doesn't connect with the main area.


The result is correct.

The area of the enclave is too small to involve in the calculation. Therefore, the result data doesn't include the area.
Calculate based on source images
v
Calculate based on image pyramids
v


3 bands 8 bit unsigned TIFF image
NoValue: not unique, including neighbor values in the tolerance range.
Doesn't support the automatical calculation of valid areas of image data that has multiple NoValues.
Calculate based on source images
--
Calculate based on image pyramids
--
- Read a clip file
If each of your image has the corresponding clip area saving in the same named separate .shp file, you can adopt the funtion to clip image data.
Besides, when adding images to a mosaic dataset, the application allows you to update the entrance of a clip dataset by reading a clip file. For specific information, please refer to Create Mosaic Dataset - Read Clip Bounds. If no .shp files correspond with your image data, its footprint is the clip area by default.
The way of reading a clip file applies to the kind of images that have multiple NoValues.

Figure: the NoValue areas have multiple NoValues. After getting clip areas of images, you can use the clip areas to make the application display the valid areas of your images only by setting the Clip Type to Data Clip in the Layer Properties panel. For specific information, please refer to Clip Visible Image.
- Export Bounds: Set the bounds of file or file list you want to export. Four ways are supplied for the settings of bounds: Whole (the whole map), Draw Range (draw a range in the map window), Select Object (select one or more objects as the range), and Copy/Paste (an existed coordinate value). The Select Object can be worked unless there is at least one region dataset, and for the Draw Range feature, the mosaic dataset must be opened.
- Parameter Settings: Set what other files you want to export together with your image data. You can export overviews and attached files like coordinates and pyramids. If you select Export File List, the application will export the list of images and the list of overviews within the bounds.
- Result Data: Set the output path of data.
- Save as Dataset: Export your mosaic dataset as a new dataset and save it to a datasource.
Parameter Description
There are three options provided for rebuilding bounds in the dialog box.
Note: After rebuilding clip areas, you can consider whether to update the overview map according to your needs.
 Statistics Info
Statistics info prepares data for displaying your mosaic dataset in differently stretching ways. Statistics info is essential for the stretching way setting.
Function Entrances
Right click your mosaic dataset and select Change Mosaic Dataset > Compute Statistic Data. And then the application will count the maximum value, minimum value, average, standard deviation, and variance of images one by one. The application will generate separate statistical info files (*.xml) for every image in its storage path. The resulting file name is the same as the corresponding image.
 Export Data
Functional Entrance
Right-click your mosaic dataset and select "Export Data..." to open the "Export Mosaic Data" dialog box.
Parameter Description: To export a file or a file list, please set the following parameters:
 Related Topics