The uneven spatial distribution of economic society, land use, biodiversity, and climate characteristics is a manifestation of the diversity of spatial differentiation in the process of natural and social economic development. Spatial heterogeneity, also known as spatial hierarchical heterogeneity, refers to a geographical phenomenon where the variance within strata is smaller than the variance between strata, which is represented by classification or subareas. Such as geographical divisions, climate zones, land use maps, and national main functional zoning. Various types of habitats, such as different landforms, soil types and climates, provide refuge for a large number of species. Spatial stratified heterogeneity is the regularity of stratification manifested by spatial heterogeneity and of great significance to the study of geography.
Geodetector is a new statistical method to detect spatial stratified heterogeneity and reveal the driving factors behind it. The core idea is based on the assumption that if an independent variable has an important influence on a dependent variable, then the spatial distribution of the independent variable and the dependent variable should be similar. Geographic differentiation can use geodetectors for statistical analysis. Geodetectors have two major advantages. First, geographic detectors can detect both numerical data and qualitative data. Second, it is possible to detect the interaction of two factors on the dependent variable. By calculating and comparing the q value of each single factor and the q value of the superposition of the two factors, the geodetector can judge whether there is an interaction between the two factors, as well as the strength, direction, and linearity or nonlinearity of the interaction. The superposition of two factors includes both the multiplication relationship and other relationships. As long as there is a relationship, it can be test.
Note: The principle and applications of the feature quote from WANG Jinfeng and XU Chengdong: Geodetector: Principle and prospective [J]. Acta Geographica Sinica, 2017, 72(1): 116-134.
Functional Theory
Geodetectors are used to analyze spatial stratified heterogeneity, mainly including 4 detectors (factor detector, risk zone detector, ecological detector, interaction detector). The analysis results can answer the following questions respectively.
- Is there spatial stratified heterogeneity? What factors caused this spatial stratified heterogeneity?
- Are there significant regional differences in variable Y?
- What is the relative importance of factor X?
- Does factor X act independently on dependent variable Y or has a generalized interaction effect?
Stratified heterogeneity and factor detector
Detects the spatial stratified heterogeneity of Y and what extent the factor X explains the the spatial stratified heterogeneity of Y (figure 1) and uses q to measure. The formula is:
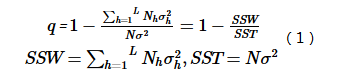 |
In the formula h can be 1, ��. L is the strata (or subareas) of variable Y or factor X. Nh and N are the strata h and the number of all subareas. σ2h and σ2 are the variances of the strata h and Y value of all subareas. SSW and SST are Within Sum of Squares and Total Sum of Squares respectively. q ranges from 0 to 1. The greater the q, the more obvious the spatial stratified heterogeneity of y. If the stratified situation happened because of independent variable X, the greater the q, the stronger the explanation of independent variable X to attribute Y. If q is equal to 1, X controls the spatial distribution of Y completely. Else if q is 0, X has no relationship with Y. q means that X explains 100*q% Y.
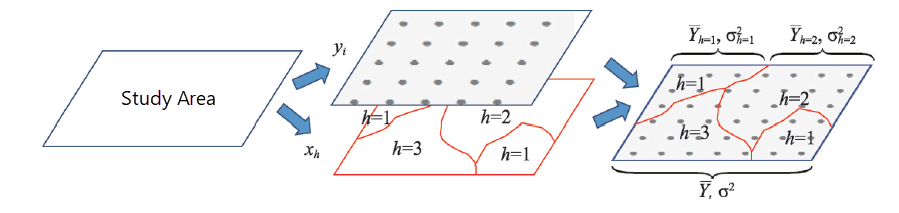 |
| Figure 1: The principle of geographical detector |
A small change of q to meet the distribution of non-center F (Wang et al.,2016a).
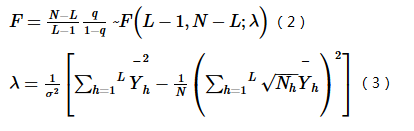 |
In the formula, λ is the non-center parameter. Yh is the mean value of strata h.
Detection of interaction
Identifies the interaction between different risk factors Xs, that is, assesses whether the cooperation of factors X1 and X2 can increase or decrease the explanatory power of the dependent variable Y, or whether the effects of these factors on Y are independent of each other. The assessment method is to calculate the q value of two factors X1 and X2 to Y: q(X1) and q(X2), calculate the q value: q(X1∩X2) when they interact with each other (new polygonal distribution formed by the tangency of two overlapping variables X1 and X2), and compare q(X1) and q(X2) with q(X1∩X2). The relationships between two factors can be divided into the following several classes:
 |
| Figure: Detection of interaction |
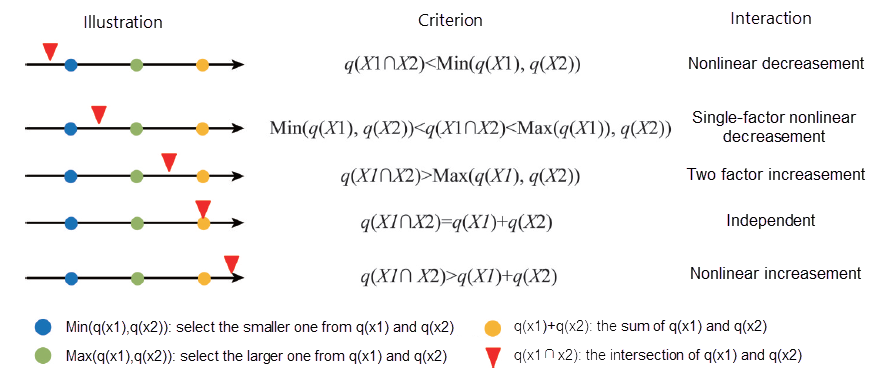 |
| Figure: Types of interaction between two covariates |
Detection of Risk Area
Uses t statistic to test whether the attribute mean values of two sub areas are significantly different.
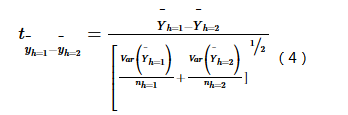 |
In the formula Yh is the mean value of subarea h like the incidence or prevalence rate of a sickness. nh is the number of samples in subarea h. Var denotes variance. t approximately obeys Student's t distribution. The formula to get the degree of freedom is:
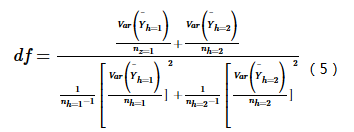 |
Null hypothesis H0: Yh=1=Yh=2. If H0 is rejected at the confidence level α, it is considered that the attribute mean values of two sub areas are significantly different.
Ecological Detection
Uses F statistic to contrast whether the influence of two factors X1 and X2 on the spatial distribution of attribute Y is significantly different.
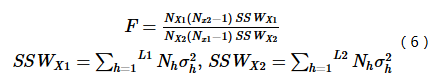 |
In the formula NX1 and NX2 denote the number of factor X1 and X2 respectively. SSWX1 and SSWX2 represent within sum of X1 and within sum of X2. L1 and L2 represent the number of stratifications of variables X1 and X2, respectively. The null hypothesis H0: SSWX1=SSWX2. If H0 is rejected at the significance level of ��, the influence of the two factors X1 and X2 on the spatial distribution of attribute Y is significantly different.
We use the geographic detector to analyze the incidence of neural tube defects (NTDs) in a certain county. Environmental factors include soil type, elevation, and hydrological basin. The village center is used as the sample unit. The figure below shows the data of environmental factor analysis.
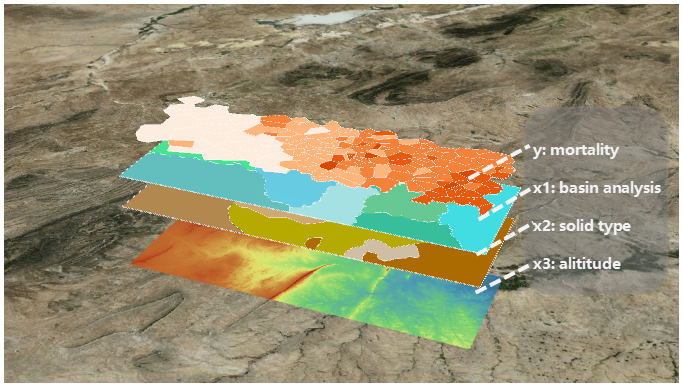 |
| Figure: The prevalence of neural tube defects and its covariates or proxies |
Operating Instructions
iDesktopX provides two functional entrances.
- Spatial Analysis > Spatial Statistical Analysis > Analyzing Mode > Geographic Detector.
- Toolbox > Spatial Statistical Analysis > Analyzing Mode > Geographic Detector.
Main Parameters
- Source Data: set your dataset that you want to analyze. The supported data type can be points, lines, polygons, or attributes.
- Dependent Variable Field: a variable to be measured or recorded. It will change with the change of other variable(s). It is a numerical value like the the incidence of neural tube defects (NTDs).
- Independent Variable Field: It is the factor or condition causing changes in the dependent variable. It is the explanatory variable of the dependent variable. You can set multiple explanatory variables, such as soil type, elevation, and hydrological basin at the same time. Note that the independent variable here should be a category variable. If it is a numerical value, you need to group or stratify it to make the variance within the group the smallest and the variance between the groups the largest. You can group it based on expert knowledge, with k-means, or by equal division after sorting. You should ensure that there are at least two sample units of the dependent variable in each group or strata, thereby calculating the mean or variance of strata.
- Resulting Data: specify a datasource to save the resulting data. Four detectors will generate new attribute tables respectively to save resulting data.
Output
After all setttings we mentioned above, click Run icon button. All analysis results will be saved as attribute tables and output in the output window.
Factor Detector
Detects the spatial stratified heterogeneity of Y and what extent the factor X explains the the spatial stratified heterogeneity of Y. Uses q to measure. If the stratified situation happened because of independent variable X, the greater the q, the stronger the explanation of independent variable X to attribute Y.
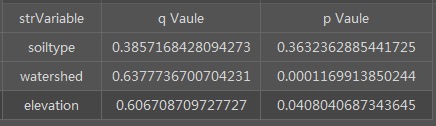
The attribute table FactorDetector_result records all values of the risk factor q. From the table we learned that watershed has the highest q, which means water is the main factor that decides the stratified heterogeneity of NTDs.
Detect Risk Area
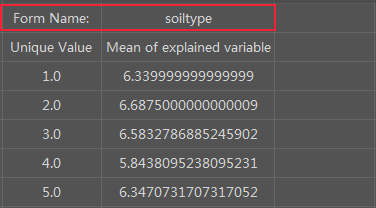
Detects whether the mean value of attributes in each area is significant.
The attribute table RiskDetector_result records all detecting results to each risk factor. Such as for soil types (soiltype), Unique Value (category variable) records the serial number of each environmental factor. Mean od explained variable denotes the average incident of NTDs in each type of soil.
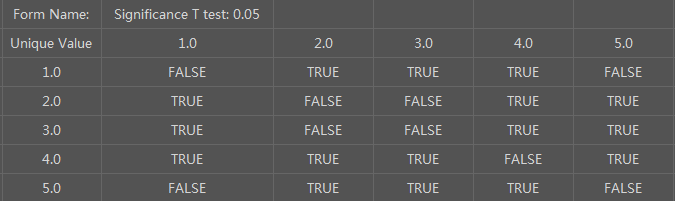
The matrix (from row 10 to row 15) records whether the incidence of NTDs in a type of soil is significantly higher than in other typed of soil. The t statistic is 0.05. TRUE means significantly higher. FALSE means no.
Ecological Detection
Contrasts whether the influence of different factors on the spatial distribution of attribute Y is significantly different.
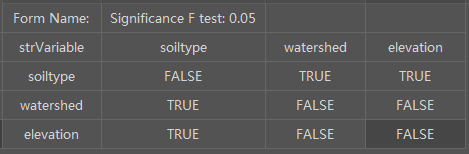
The attribute table EcologicalDetector_result records all ecological detecting results. The t statistic value is 0.05. TRUE indicates that there is significant difference. FALSE denotes that there is not significant difference. For the spatial distribution of NTDs, the soil type is significantly different from other factors.
Detection of Interaction
Identifies the interaction between different explanatory variables and assesses whether the cooperation of two factors can increase or decrease the explanatory power of the dependent variable.
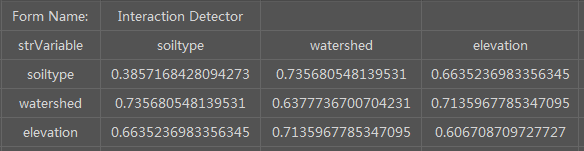
The attribute table InteractionDetector_result records all results on risk area detection. It shows all q values after two factors work together with each other. We can learn that the cooperation of the two factors has more effect on NTDs' spatial distribution than one factor.

The results of the interaction of detection are used for assessing how much the independent variables have influences on the dependent variables. the interaction types include:
- Weaken, nonlinear: weaken nonlinearly
- Weaken, uni-: single factor nonlinearly weakening
- Enhance, bi-: double factors enhancing
- Independent: independent
- Enhance,nonlinear: enhance nonlinearly
We can know that the interaction of two factors on spatial distribution of NTDs is double factors enhancing.
 Related Topics
 Incremental Spatial Autocorrelation