Optimized Hot Spot Analysis uses the parameters derived from the characteristics of input data to perform Hot Spot Analysis, and reflects the distribution of hot spots and cool spots. Such as: given incident points and weight features, analyzes the distribution of incident points to generate optimal cold and hot spot analysis result.
How the feature works
According to the input features, optional assessment fields, regions with incident points, aggregation methods, analyses whether an incident point locate a hot spot region or a cold spot region. The result dataset includes: Counts, Gi_Zscore, Gi_Pvalue, Gi_ConfInvl, for details, please reference Hot Spot Analysis.
The supported incident data can be points or regions. Provides four aggregation methods, and the required minimum number for every method is as follows:
| Minimum Number of Incidents | Aggregation Way | Minimum Number of Features After Aggregation |
|---|---|---|
| 60 | Grid region, without providing the boundary data of the region where incidents are possible | 30 |
| 30 | Grid region, providing the boundary data of the region where incidents are possible | 30 |
| 30 | Polygon, calculating incident points within the setting aggregation region | 30 |
| 60 | Calculating the snapping distance to aggregate incidents nearby | 30 |
Applications
The feature is used to identify the spatial cluster with statistically significant high values (hot spots) and low value (cold spots). It can aggregate incident data automatically, identify an appropriate analyzing scale, and correct multiple testing and spatial dependence. The tool queries data to determine the settings which will be used to generate optimal hot spot analysis results. If you want to full control the settings, the Hot Spot Analysis should be adopted.
 Function Entrances
- Spatial Statistical Analysis > Cluster Distributions > Optimized Hotspot Analysis.
- Toolbox > Spatial Statistical Analysis > Cluster Distributions > Optimized Hotspot Analysis.
Main Parameters
- Source Dataset: Set a vector dataset (point or region) to execute Optimized Hot Spot Analysis.
- Assessment Field: select an assessment field for the analysis. If the source data is a point dataset, the field can be null. If the source data is a region dataset, you are required to set an assessment field.
- Result Settings: Set a datasource and a dataset to preserve the results.
Note: if you specify the assessment field, the feature will run directly. Otherwise, the feature will use the provided aggregation method.
Result Explanation
There are four property fields included in the result dataset: Counts, Gi_Zscore, Gi_Pvalue, Gi_ConfInvl, Gi_ConfInvl.
- Counts records number of points within a correspoding analysis region. The result field wont appear unless the source dataset is a point dataset and without setting an assessment field.
- If the feature's Gi_Zscore is high and the Gi_Pvalue is small, then there is a high value spatial clustering. If Gi_Zscore is low and negative and Gi_Pvalue is small, then there is a low value spatial clustering. The higher the Gi_Zscore (or lower), the greater the clustering degree. If Gi_Zscores are close to zero, there is no obvious spatial clustering.
- In the premise of spatial aggregation, Gi_Zscore is negative, which indicates that the place is a cold spot area and the corresponding Gi_ConfInvl field is negative. The Gi_Zscore is positive, indicating that the place is a hot spot area, and the corresponding Gi_ConfInvl field is positive.
- The Gi_ConfInvl field identifies the hot and cold spots of statistical significance. The features of Gi_ConfInvl for +3 to -3 reflect the statistical significance of the confidence level of 99%. The features of Gi_ConfInvl for +2 to -2 reflect the statistical significance of the confidence level of 95%. The features of Gi_ConfInvl for +1 to -1 reflect the statistical significance of the confidence level of 90%. The clustering of the features of Gi_ConfInvl for 0 was not statistically significant.
The following table shows:
| Gi_Zscore(Standard Deviations) | Gi_Pvalue(probability) | Gi_ConfInvl value | Gi_ConfInvl |
|---|---|---|---|
| <-1.65 or >1.65 | <0.10 | -1 , 1 | 90% |
| <-1.96 or >1.96 | <0.05 | -2 , 2 | 95% |
| <-2.58 or >2.58 | <0.01 | -3 , 3 | 99% |
Instance
Sample data: click OptimizedHotSpot sample data to download the sample data.
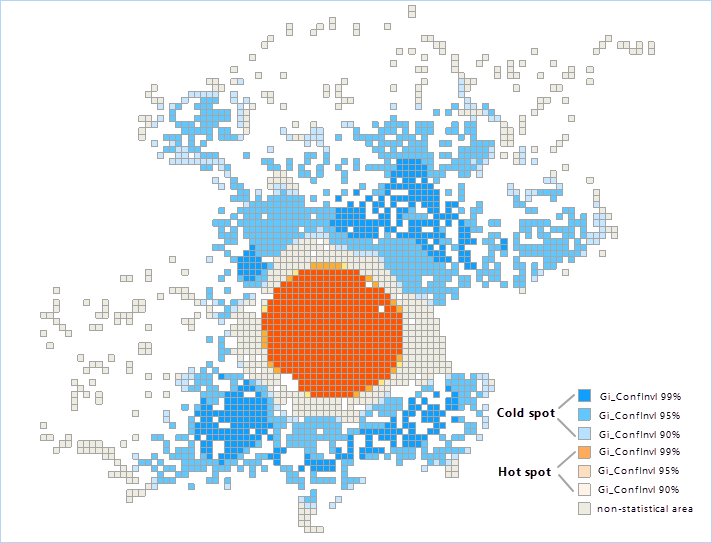
Take the point dataset as an example:
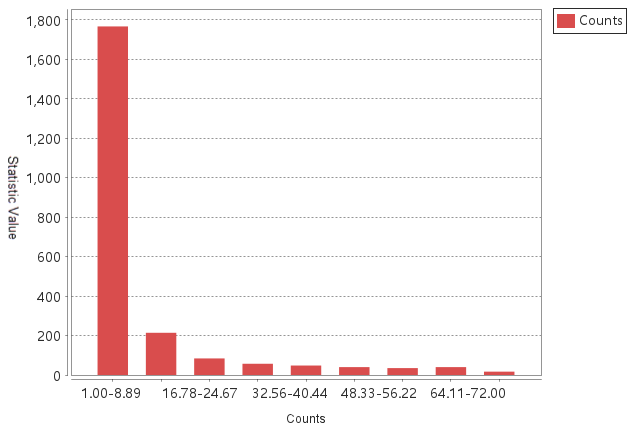
Set Datasource to OptimizedHotSpot, Dataset to WeiBo_P, and Aggregate Method to Grid Polygon, we got the optimized hotspot analysis result and the statistic diagram that indicates the number of incident points on each grid.
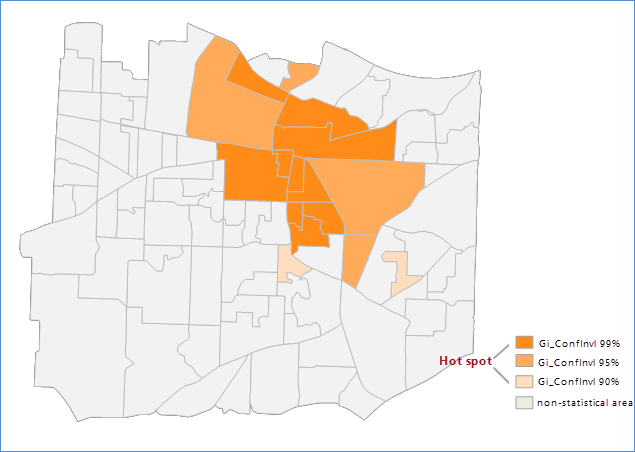
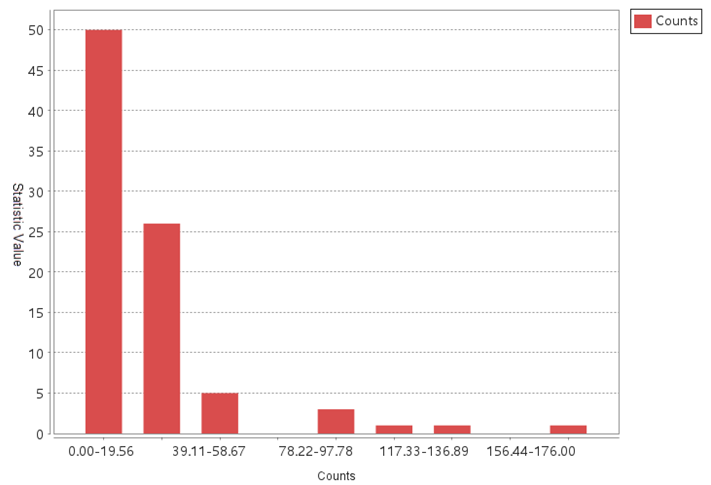
Set Datasource to OptimizedHotSpot, Dataset to T911Calls, and Aggregate Method to Aggregate Polygon, we got the optimized hotspot analysis result and the statistic diagram that indicates the number of incident points on each grid.
 Related Topics