Vector Streaming Data
The posting of vector streaming data is triggered automatically. After the broadcast connects the service, it can send the collected data to the server automatically. iDesktopX connects the corresponding server to accept the real-time vectors streaming data forwarded by the server. The data-transfer formats can be GeoJson and WKT. The coordinate system of the accepted data is WGS 1984 by default.
Functional Entrances
Online->Real-time Stream Data->Real-time Stream Data.
Operating Instructions
- Start iDesktop DataFlow Service.
- Click Online tab > Real-time Stream Data > Real-time Stream Data and select Add icon button to create real-time streaming data.
- Name: enter a name. The name will be taken as the names of the temporal datasource and the dataset of the real-time streaming data.
- In the pop-up dialog box, enter the service (iDesktop DataFlow Service) address of streaming data in the Service Address text box. The format of service address is server IP:port. For example: 10.10.1.56:8125.
- Click the Connection Test button to test whether the machine can connect the server successfully.
- Save Data: check the box to allow the application to save streaming data as a local dataset. The application saves data every 10 seconds by default.
- Save Mode: provides two modes including Append and New.
- New: creates a new datasource and a new dataset and specifies its type to save streaming data.
- Append: appends streaming data to an existing dataset. But the dataset should have a date field.
- Datasource: select a datasource to save vector streaming data.
- Dataset: if you set the Save Mode to New, you can enter the name of streaming data you want to create directly. If you set the Save Mode to Append, you can choose a dataset from the drop-down list.
- Type: specify the type of dataset you want to create. The supportive types can be point, line, region, and CAD.
- Date Field: if you set the Save Mode to Append, you need to specify a date field to save the time of accepting streaming data. You can choose an existing date field of the target dataset or enter a name in the text box to create a new date field. If the text box is empty, the application will create a new dataset with the default name ReceiveDateTime.
- Save Mode: provides two modes including Append and New.
- Add to Map: check the box to add the accepted streaming data to the current map window. If you don't open a map window, the application will open a new map window to load streaming data.
- Refresh Rate: specify a refresh rate. The application will refresh streaming data every 1000ms by default.
- Field Settings: the field list displays fields of streaming data. You can set the resulting name and type of each field.
- Result Field: double click an item in the Result Filed column to specify a field name. If a result field name is empty, the corresponding field won't be saved.
- Field Type: double click an item in this column to change the field type.
- After a successful connection test and the above parameter settings, click the OK button to accept vector streaming data collected by the broadcast side.
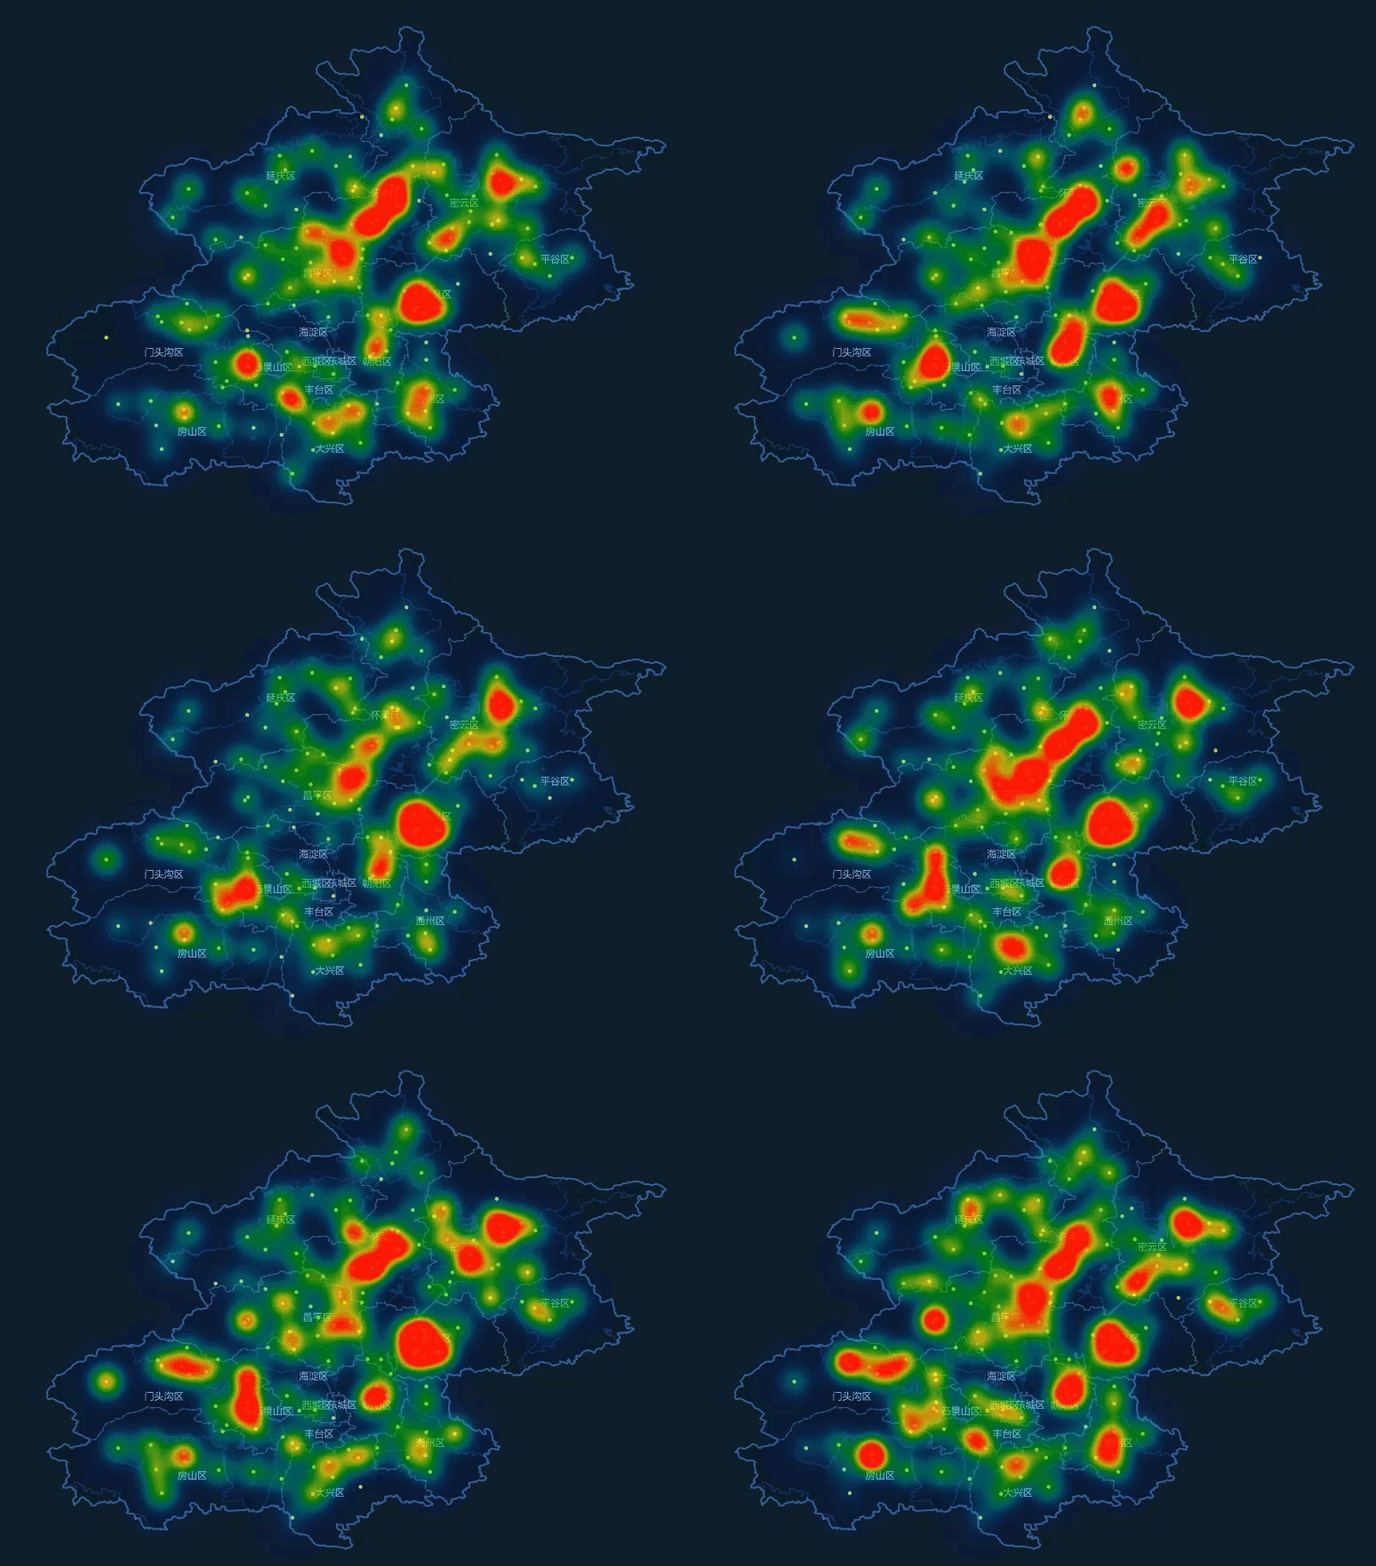
We accepted Beijing traffic jam streaming data. Based on the data, we created the following heat map to render and display data.

Note
- If multiple broadcasts sent data to the same server at the same time, iDesktopX can access all data from these broadcasts.
- iDesktopX can access streaming data forwarded by multiple servers.