


The SQL Query function in SuperMap can group search results based on specified one or more fields, grouping records with the same values in the specified field together.
Specify Single Field Grouping
Below, using the Province_R data from the sample data source PopulationAndEconomy as an example, we will group and count the number of provinces in the eastern, western, central, and northeastern regions of China.
- Open the PopulationAndEconomy data source from the sample data in the Workspace Manager.
- In the Spatial Analysis tab -> Query group, select SQL Query.
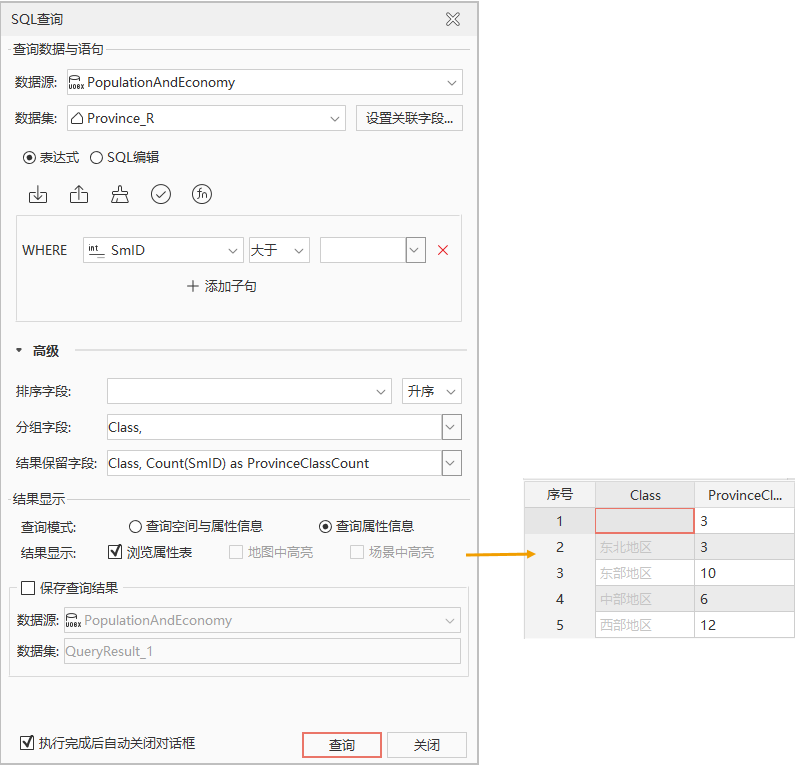
- In the SQL Query dialog, select the data source PopulationAndEconomy and the dataset Province_R.
- Use the Clear button in the expression toolbar to clear the content in the expression input box.
- In Show Results, check Query Properties.
- Under the Advanced node, set the Group Field to: Class.
- In the Result Reserved Fields, enter: Class, Count(SmID) as ProvinceClassCount.
This indicates that the Class field is retained in the result data. It calculates the number of provinces in each group based on the group field Class and saves the result in the ProvinceClassCount field.
- Click Query, and the result table window will pop up, displaying the content as shown in the figure below:
Specify Multiple Fields Grouping
Simply check or directly enter multiple select fields in the Group Field dropdown checkbox. The program will first group the attribute table based on the first input field, then by the second field, and so on.
Below, still using the Province_R data from the sample data source PopulationAndEconomy as an example, we will group and count based on the number of provinces per region, then further by map color.
- Open the PopulationAndEconomy data source from the sample data in the Workspace Manager.
- In the Spatial Analysis tab -> Query group, select SQL Query.
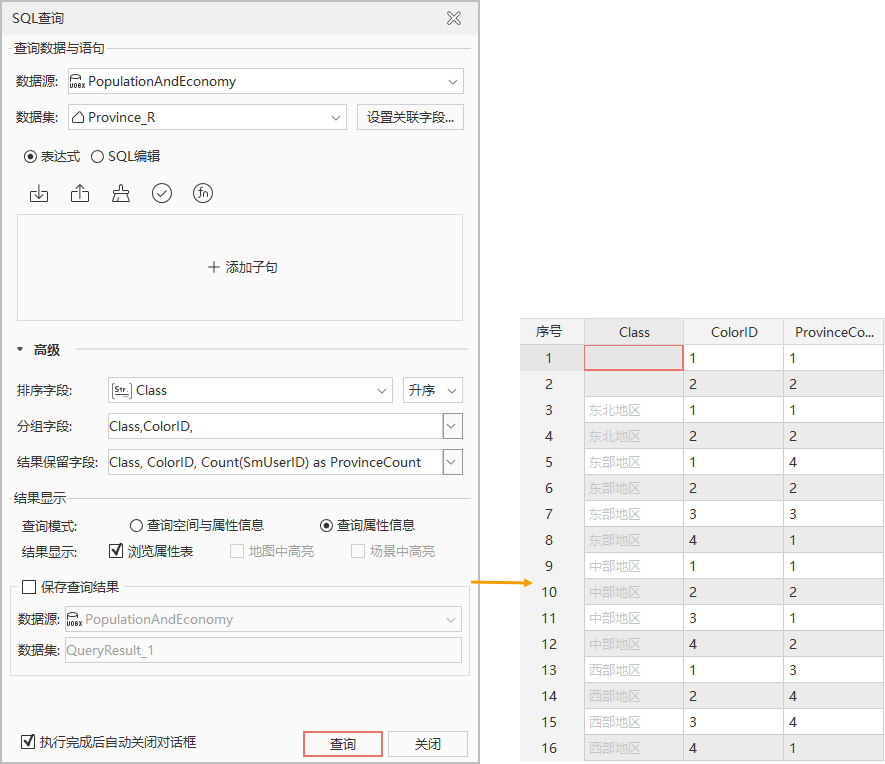
- In the SQL Query dialog, select the data source PopulationAndEconomy and the dataset Province_R.
- Use the Clear button in the expression toolbar to clear the content in the expression input box.
- In Show Results, check Query Properties.
- In the Sort Field, enter: Class, and select ascending sort by. This means the results will be sorted in ascending order based on the Class field.
- In the Group Field, enter: Class, ColorID. This indicates grouping first by the Class field, then by the ColorID field.
- In the Result Reserved Fields, enter: Class, ColorID, Count(SmUserID) as ProvinceCount.
This indicates that the Class and ColorID fields are retained in the result. It calculates the number of provinces in each group based on Class and ColorID fields and saves the calculation result in the ProvinceClassCount field.
- Click Query, and the result table window will pop up, displaying the content as shown in the figure below:
Related Topics
Common Expressions for Building SQL Query
Function Description for Building SQL Query