Best route analysis
The function is to analyze the best and effective connection path between two points according to the specified starting and ending nodes in combination with the best path analysis in iServer traffic network analysis service, and can also be used to judge the connectivity of specified two points in underground pipelines or roads. At this stage, this function is based on 2D network dataset, and the 2D points and lines used for construction have height, which can be constructed into 3D point and line dataset and 3D network dataset. For example, 3D network dataset with vertical pipeline is not applicable temporarily.
operating steps
- Data preparation:
- First, it is necessary to construct the 2D point and line dataset representing pipe points and pipelines (road routes) into a 2D network dataset (please refer to Hypergraph iDesktop X product for specific construction of 2D network dataset), and publish the traffic network analysis service through the workspace;

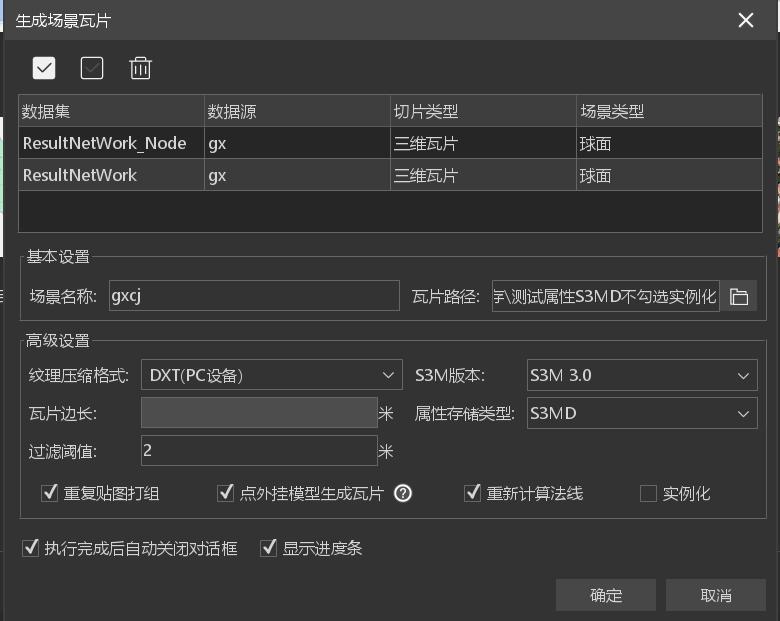
- At the same time, prepare 3D model data for UE display, process the 2D point and line data into 3D data set through iDesktopX desktop, then construct 3D network data set, and construct 3D network model by making thematic map, etc., and save it as scene. Finally, model tiles of arc segments and nodes of network data are obtained by generating scene tiles, and loaded into UE for display. Note, please uncheck instantiation.
- Through the process of processing two-dimensional point line data into three-dimensional model tiles, the IDs of arc segments and nodes in the three-dimensional model correspond to those of arc segments and nodes of a two-dimensional network data set, ensuring that the ID values returned by analysis correspond to the IDs of model tiles, so that the analysis results can be quickly applied to the front end.
- After processing the data, load it into the scene by adding layers.
- First, it is necessary to construct the 2D point and line dataset representing pipe points and pipelines (road routes) into a 2D network dataset (please refer to Hypergraph iDesktop X product for specific construction of 2D network dataset), and publish the traffic network analysis service through the workspace;
- Use analysis function
- Fill in network address: fill in the address of path analysis in traffic network analysis service, such as:
- http://localhost:8090/iserver/services/transportationAnalyst-X/rest/networkanalyst/X@X/path
- Node ID: Enter the ID of the start and end nodes to be analyzed. The plug-in takes node ID as an example, but the SDK interface can also use latitude and longitude points to query the nearest node according to latitude and longitude points. At the same time, secondary development can also be carried out to obtain the object ID mode by clicking query.
- Weight field: Smlength by default.
- Select layer: Select the corresponding arc segment, pipe point model tile layer, highlight the object used for analysis results.
- After clicking Analyze, the plug-in sends a request to Path Analyze, and after returning the ID of the resulting object, the object is highlighted in the scene.
- Fill in network address: fill in the address of path analysis in traffic network analysis service, such as:


